o Discern when to use a particular measure of central tendency and when not to
o Know how to avoid deceptive or ambiguous use of a measure of central tendency
We have thus seen that although calculating a measure of central tendency is a straightforward process, choosing the appropriate one to accurately represent a data set is not necessarily as straightforward. In some cases, such as that of the symmetrical histogram shown below, the mean, median, and mode all coincide at the same value.
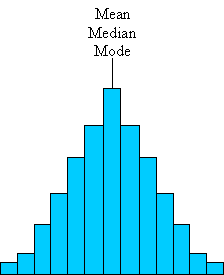
In other cases, these three measures vary dramatically, and not every measure is necessarily appropriate for characterizing a particular data set. It is your job, when analyzing statistical data, to choose the measure of central tendency that best describes the data. Be sure to consider the context of the data, the audience to whom you are presenting the results, and your own biases when making this selection. When in doubt, you can always cite more than one of these measures! Sometimes, presenting two or more measures helps provide a better picture and also helps provide protection from potential criticism.
Consider, for example, the data set and corresponding graph shown below.
|
Data Value |
|
|
1 |
1 |
|
2 |
11 |
|
3 |
5 |
|
4 |
4 |
|
5 |
2 |
|
6 |
1 |
|
7 |
1 |
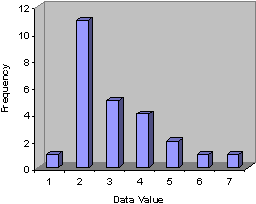
Note that the graph (and the data table) shows a pronounced frequency peak at a value of 2; we would thus expect that our measure of central tendency would reflect this observation. If we calculate each of the measures that we have studied so far, we find that the mean is 3.08, the median is 3 (the 13th out of 25 total data values), and the mode is 2. Let's look at the (approximate) location of each of these on the graph.
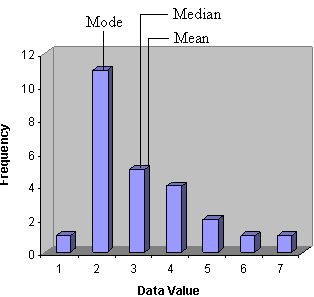
The mean, which might be the first choice in many situations, is the farthest from the peak value of 2. The median isn't much better--it is only slightly closer to the peak. The mode, however, hits the main peak exactly. So, which of these measures best describes the data set? The answer to this question lies as much in the context of the statistical analysis as it does in the mathematical aspects shown so far. Indeed, the mode appears to be the best choice, since it selects the peak of the frequency data. On the other hand, the mode doesn't have much to say about how the data is distributed to either side. For instance, both of the following distributions also have a mode of 2.
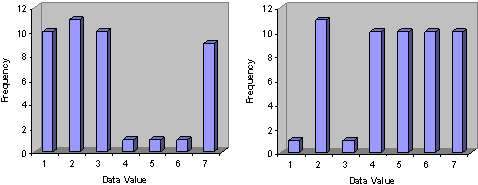
Thus, although the mode picks out the highest frequency peak, it is lacking when it comes to taking into account the frequencies of other data values. If the context of the analysis involves finding the most likely outcome of the roll of a loaded die, then the mode might be the best measure of central tendency when the data set is the outcomes of a number of trials. If the context of the analysis surrounds the incomes of a certain population, then the mode may be far from the best measure of central tendency. In such a case, the mean or (perhaps more likely) the median may best describe the center of the data.
Needless to say, choosing a single measure of central tendency for a particular data set can be challenging. As mentioned previously, however, you need not always be restricted to a single number: sometimes the best choice is not to simply cite the mean, median, or mode, but to cite some combination thereof. Again, it is your job to accurately describe the data. If, for instance, the data above corresponded to household income (where each data value corresponds to, say, a multiple of $10,000), then an unscrupulous statistician might only cite the mode so as to make the population seem poorer than it really is. A better choice would likely be the median, since half the population makes at most the median value, and half the population makes at least the median value.
Use of the median to describe the center of a data set has the effect of limiting the influence of small numbers of very large or very small data values. When dealing with incomes, for instance, the presence of just a few people with extremely large incomes can skew the mean to a much higher value than that of the median. When the effect of these larger (or smaller) values needs to be considered, however, the mean is a better measure than the median or mode. Again, these decisions need to be made in accordance with the context of the analysis and with a mind to how a particular statistic might be misinterpreted.
Practice Problem: Find the mean, median, and mode of the following data set with associated frequencies. Also determine which of these three measures of central tendency best describes the data.
|
Data Value |
Frequency |
|
1 |
1 |
|
5 |
3 |
|
7 |
5 |
|
10 |
6 |
|
24 |
2 |
|
39 |
9 |
|
57 |
8 |
|
103 |
3 |
|
294 |
4 |
|
1,023 |
1 |
|
12,574 |
1 |
Solution: Let's start with the mean μ, since we can easily calculate this value directly using the data values and frequencies.

![]()
Thus, we see that the mean of these data is 373.2. Next, let's determine the mode, which we can find by looking for the largest frequency value. According to the table, the mode of the data is 39. Now, we can calculate the median. Note that the data set contains 43 values; the median is therefore the 22nd value. Let's rewrite the table with a cumulative frequency column.
|
Data Value |
Frequency |
Cumulative Frequency |
|
1 |
1 |
1 |
|
5 |
3 |
4 |
|
7 |
5 |
9 |
|
10 |
6 |
15 |
|
24 |
2 |
17 |
|
39 |
9 |
26 |
|
57 |
8 |
34 |
|
103 |
3 |
37 |
|
294 |
4 |
41 |
|
1,023 |
1 |
42 |
|
12,574 |
1 |
43 |
We can see from the cumulative frequency column that the 22nd value is 39, since 22 falls between 26 (for 39) and 17 (for 24).


